import pandas as pd
import numpy as np
import matplotlib.pyplot as plt
import sklearn.linear_model
import sklearn오버피팅, 다중공선성
linear_model
오버피팅은 뭐고, 다중공선성은 왜 발생할까? 그리고 해결은 어떻게 할까?
해당 자료는 전북대학교 통계학과 최규빈 교수님의 강의 내용을 토대로 재구성되었음을 밝힙니다.
1. 라이브러리 imports
2. 언더라잉과 오차항
- 만약 내가 원한다면, 관련이 있든 없든 무수히 많은 데이터를 모을 수 있다고 가정하자…
df = pd.read_csv('https://raw.githubusercontent.com/guebin/MP2023/main/posts/employment.csv')
df

df_balance = pd.DataFrame((np.random.randn(500,5000)>0.5).reshape(500,5000)*1,columns = ['X'+str(i) for i in range(5000)])
df_merged = pd.concat([df,df_balance],axis=1)
df_merged| toeic | gpa | employment | X0 | X1 | X2 | X3 | X4 | X5 | X6 | ... | X4990 | X4991 | X4992 | X4993 | X4994 | X4995 | X4996 | X4997 | X4998 | X4999 | |
|---|---|---|---|---|---|---|---|---|---|---|---|---|---|---|---|---|---|---|---|---|---|
| 0 | 135 | 0.051535 | 0 | 1 | 0 | 0 | 1 | 0 | 0 | 0 | ... | 1 | 0 | 1 | 0 | 0 | 1 | 1 | 1 | 1 | 1 |
| 1 | 935 | 0.355496 | 0 | 0 | 0 | 0 | 0 | 0 | 0 | 0 | ... | 0 | 1 | 0 | 0 | 0 | 1 | 0 | 0 | 0 | 0 |
| 2 | 485 | 2.228435 | 0 | 1 | 0 | 1 | 0 | 0 | 1 | 0 | ... | 0 | 0 | 1 | 1 | 0 | 1 | 0 | 1 | 0 | 1 |
| 3 | 65 | 1.179701 | 0 | 1 | 1 | 0 | 0 | 1 | 1 | 1 | ... | 0 | 1 | 0 | 0 | 0 | 0 | 1 | 0 | 0 | 0 |
| 4 | 445 | 3.962356 | 1 | 0 | 0 | 0 | 0 | 0 | 1 | 0 | ... | 1 | 0 | 0 | 0 | 0 | 1 | 0 | 0 | 1 | 0 |
| ... | ... | ... | ... | ... | ... | ... | ... | ... | ... | ... | ... | ... | ... | ... | ... | ... | ... | ... | ... | ... | ... |
| 495 | 280 | 4.288465 | 1 | 0 | 0 | 0 | 1 | 1 | 1 | 0 | ... | 0 | 1 | 0 | 0 | 0 | 0 | 0 | 0 | 0 | 0 |
| 496 | 310 | 2.601212 | 1 | 0 | 1 | 1 | 0 | 0 | 1 | 1 | ... | 0 | 0 | 0 | 0 | 0 | 0 | 0 | 1 | 0 | 1 |
| 497 | 225 | 0.042323 | 0 | 0 | 0 | 0 | 0 | 1 | 0 | 0 | ... | 0 | 0 | 1 | 0 | 0 | 1 | 0 | 0 | 0 | 0 |
| 498 | 320 | 1.041416 | 0 | 1 | 0 | 0 | 0 | 1 | 0 | 1 | ... | 0 | 0 | 0 | 0 | 1 | 0 | 0 | 1 | 0 | 0 |
| 499 | 375 | 3.626883 | 1 | 0 | 0 | 0 | 0 | 0 | 0 | 0 | ... | 0 | 0 | 0 | 1 | 1 | 0 | 0 | 0 | 0 | 0 |
500 rows × 5003 columns
employment의 예측과 상관이 없을 개인의 선호,balance_game을 가져왔다. (5000종류)
## df_train, df_test =  sklearn.model_selection.train_test_split(test_size = 0.2) 이걸로 해도 된다.
## step 1
X = df_merged.drop(['employment'], axis = 1)[:400]
XX = df_merged.drop(['employment'], axis = 1)[400:]
y = df_merged.employment[:400]
yy = df_merged.employment[400:]

## step 2
predictr = sklearn.linear_model.LogisticRegression()

## step 3
predictr.fit(X, y)

## step 4
predictr.score(X, y), predictr.score(XX, yy)
C:\Users\hollyriver\anaconda3\envs\py\lib\site-packages\sklearn\linear_model\_logistic.py:460: ConvergenceWarning: lbfgs failed to converge (status=1):
STOP: TOTAL NO. of ITERATIONS REACHED LIMIT.
Increase the number of iterations (max_iter) or scale the data as shown in:
https://scikit-learn.org/stable/modules/preprocessing.html
Please also refer to the documentation for alternative solver options:
https://scikit-learn.org/stable/modules/linear_model.html#logistic-regression
n_iter_i = _check_optimize_result((1.0, 0.79)쓸모없는 변수(y와 상관관계가 낮은 변수)를 사용해서 오버피팅되었다. train score가 상당히 높게 나왔다.(오차항까지 예측한 상황)
df = pd.read_csv('https://raw.githubusercontent.com/guebin/MP2023/main/posts/employment.csv')

# 1
X = df.drop(['employment'], axis = 1)[:400]
XX = df.drop(['employment'], axis = 1)[400:]
y = df[['employment']][:400]
yy = df[['employment']][400:]

# 2
prdtr = sklearn.linear_model.LogisticRegression()

# 3
prdtr.fit(X,y)

# 4
prdtr.score(X,y), prdtr.score(XX, yy)
C:\Users\hollyriver\anaconda3\envs\py\lib\site-packages\sklearn\utils\validation.py:1184: DataConversionWarning: A column-vector y was passed when a 1d array was expected. Please change the shape of y to (n_samples, ), for example using ravel().
y = column_or_1d(y, warn=True)(0.8925, 0.83)test 데이터에서 스코어가 더 높았다.
3. 다중공선성
- 아래와 같은 가짜뉴스를 읽어보자.(ChatGPT를 이용하여 생성한 가짜뉴스)
헤드라인: “텝스와 다른 영어 인증 시험들, 결국은 토익과 비슷한 결과를 보여준다?”
본문:
최근 몇 년 동안, 토익의 신뢰성에 대한 논란이 계속되어 왔습니다. 이러한 배경 속에서 텝스(TEPS), 토플(TOEFL) 등 여러 새로운 영어 능력 평가 시험이 등장하였습니다. 많은 학생들과 직장인들은 이러한 새로운 시험들이 토익보다 더 신뢰성 있고 현실적인 능력을 평가할 것이라는 기대감을 가지고 있었습니다.
그러나 최근에 발표된 연구결과에 따르면, 텝스와 다른 영어 인증 시험들도 결국에는 토익과 매우 비슷한 성적 분포와 결과를 보여주었다고 합니다. 연구 팀은 여러 시험들간의 점수 분포와 성적의 상관관계를 분석한 결과, 대부분의 시험들이 실제 영어 능력에 대해 유사한 평가를 제공한다는 결론을 내렸습니다.
“많은 사람들이 새로운 시험들이 더 현실적이거나 다양한 영어 능력을 평가할 것이라 기대했지만, 실제로는 모든 시험들이 비슷한 결과를 보여주었습니다.” 라며 연구 팀의 대표는 이렇게 언급하였습니다.
이러한 연구결과는 영어 능력 평가 시험의 표준화와 신뢰성에 대한 논의를 새롭게 불러일으킬 것으로 보입니다.
- 뉴스에 근거하여 아래의 가짜 자료를 생성했다.
df = pd.read_csv("https://raw.githubusercontent.com/guebin/MP2023/main/posts/employment_multicollinearity.csv")
df| employment_score | gpa | toeic | toeic0 | toeic1 | toeic2 | toeic3 | toeic4 | toeic5 | toeic6 | ... | toeic490 | toeic491 | toeic492 | toeic493 | toeic494 | toeic495 | toeic496 | toeic497 | toeic498 | toeic499 | |
|---|---|---|---|---|---|---|---|---|---|---|---|---|---|---|---|---|---|---|---|---|---|
| 0 | NaN | 0.051535 | 135 | 129.566309 | 133.078481 | 121.678398 | 113.457366 | 133.564200 | 136.026566 | 141.793547 | ... | 132.014696 | 140.013265 | 135.575816 | 143.863346 | 152.162740 | 132.850033 | 115.956496 | 131.842126 | 125.090801 | 143.568527 |
| 1 | NaN | 0.355496 | 935 | 940.563187 | 935.723570 | 939.190519 | 938.995672 | 945.376482 | 927.469901 | 952.424087 | ... | 942.251184 | 923.241548 | 939.924802 | 921.912261 | 953.250300 | 931.743615 | 940.205853 | 930.575825 | 941.530348 | 934.221055 |
| 2 | NaN | 2.228435 | 485 | 493.671390 | 493.909118 | 475.500970 | 480.363752 | 478.868942 | 493.321602 | 490.059102 | ... | 484.438233 | 488.101275 | 485.626742 | 475.330715 | 485.147363 | 468.553780 | 486.870976 | 481.640957 | 499.340808 | 488.197332 |
| 3 | NaN | 1.179701 | 65 | 62.272565 | 55.957257 | 68.521468 | 76.866765 | 51.436321 | 57.166824 | 67.834920 | ... | 67.653225 | 65.710588 | 64.146780 | 76.662194 | 66.837839 | 82.379018 | 69.174745 | 64.475993 | 52.647087 | 59.493275 |
| 4 | NaN | 3.962356 | 445 | 449.280637 | 438.895582 | 433.598274 | 444.081141 | 437.005100 | 434.761142 | 443.135269 | ... | 455.940348 | 435.952854 | 441.521145 | 443.038886 | 433.118847 | 466.103355 | 430.056944 | 423.632873 | 446.973484 | 442.793633 |
| ... | ... | ... | ... | ... | ... | ... | ... | ... | ... | ... | ... | ... | ... | ... | ... | ... | ... | ... | ... | ... | ... |
| 495 | NaN | 4.288465 | 280 | 276.680902 | 274.502675 | 277.868536 | 292.283300 | 277.476630 | 281.671647 | 296.307373 | ... | 269.541846 | 278.220546 | 278.484758 | 284.901284 | 272.451612 | 265.784490 | 275.795948 | 280.465992 | 268.528889 | 283.638470 |
| 496 | NaN | 2.601212 | 310 | 296.940263 | 301.545000 | 306.725610 | 314.811407 | 311.935810 | 309.695838 | 301.979914 | ... | 304.680578 | 295.476836 | 316.582100 | 319.412132 | 312.984039 | 312.372112 | 312.106944 | 314.101927 | 309.409533 | 297.429968 |
| 497 | NaN | 0.042323 | 225 | 206.793217 | 228.335345 | 222.115146 | 216.479498 | 227.469560 | 238.710310 | 233.797065 | ... | 233.469238 | 235.160919 | 228.517306 | 228.349646 | 224.153606 | 230.860484 | 218.683195 | 232.949484 | 236.951938 | 227.997629 |
| 498 | NaN | 1.041416 | 320 | 327.461442 | 323.019899 | 329.589337 | 313.312233 | 315.645050 | 324.448247 | 314.271045 | ... | 326.297700 | 309.893822 | 312.873223 | 322.356584 | 319.332809 | 319.405283 | 324.021917 | 312.363694 | 318.493866 | 310.973930 |
| 499 | NaN | 3.626883 | 375 | 370.966595 | 364.668477 | 371.853566 | 373.574930 | 376.701708 | 356.905085 | 354.584022 | ... | 382.278782 | 379.460816 | 371.031640 | 370.272639 | 375.618182 | 369.252740 | 376.925543 | 391.863103 | 368.735260 | 368.520844 |
500 rows × 503 columns
toeic0~toeic499는 유사토익을 의미
- 모르는 정보 : 사내 고용 법칙
np.random.seed(43052)
df['employment_score'] = df.gpa * 1.0 + df.toeic * 1/100 + np.random.randn(500)

df| employment_score | gpa | toeic | toeic0 | toeic1 | toeic2 | toeic3 | toeic4 | toeic5 | toeic6 | ... | toeic490 | toeic491 | toeic492 | toeic493 | toeic494 | toeic495 | toeic496 | toeic497 | toeic498 | toeic499 | |
|---|---|---|---|---|---|---|---|---|---|---|---|---|---|---|---|---|---|---|---|---|---|
| 0 | 1.784955 | 0.051535 | 135 | 129.566309 | 133.078481 | 121.678398 | 113.457366 | 133.564200 | 136.026566 | 141.793547 | ... | 132.014696 | 140.013265 | 135.575816 | 143.863346 | 152.162740 | 132.850033 | 115.956496 | 131.842126 | 125.090801 | 143.568527 |
| 1 | 10.789671 | 0.355496 | 935 | 940.563187 | 935.723570 | 939.190519 | 938.995672 | 945.376482 | 927.469901 | 952.424087 | ... | 942.251184 | 923.241548 | 939.924802 | 921.912261 | 953.250300 | 931.743615 | 940.205853 | 930.575825 | 941.530348 | 934.221055 |
| 2 | 8.221213 | 2.228435 | 485 | 493.671390 | 493.909118 | 475.500970 | 480.363752 | 478.868942 | 493.321602 | 490.059102 | ... | 484.438233 | 488.101275 | 485.626742 | 475.330715 | 485.147363 | 468.553780 | 486.870976 | 481.640957 | 499.340808 | 488.197332 |
| 3 | 2.137594 | 1.179701 | 65 | 62.272565 | 55.957257 | 68.521468 | 76.866765 | 51.436321 | 57.166824 | 67.834920 | ... | 67.653225 | 65.710588 | 64.146780 | 76.662194 | 66.837839 | 82.379018 | 69.174745 | 64.475993 | 52.647087 | 59.493275 |
| 4 | 8.650144 | 3.962356 | 445 | 449.280637 | 438.895582 | 433.598274 | 444.081141 | 437.005100 | 434.761142 | 443.135269 | ... | 455.940348 | 435.952854 | 441.521145 | 443.038886 | 433.118847 | 466.103355 | 430.056944 | 423.632873 | 446.973484 | 442.793633 |
| ... | ... | ... | ... | ... | ... | ... | ... | ... | ... | ... | ... | ... | ... | ... | ... | ... | ... | ... | ... | ... | ... |
| 495 | 9.057243 | 4.288465 | 280 | 276.680902 | 274.502675 | 277.868536 | 292.283300 | 277.476630 | 281.671647 | 296.307373 | ... | 269.541846 | 278.220546 | 278.484758 | 284.901284 | 272.451612 | 265.784490 | 275.795948 | 280.465992 | 268.528889 | 283.638470 |
| 496 | 4.108020 | 2.601212 | 310 | 296.940263 | 301.545000 | 306.725610 | 314.811407 | 311.935810 | 309.695838 | 301.979914 | ... | 304.680578 | 295.476836 | 316.582100 | 319.412132 | 312.984039 | 312.372112 | 312.106944 | 314.101927 | 309.409533 | 297.429968 |
| 497 | 2.430590 | 0.042323 | 225 | 206.793217 | 228.335345 | 222.115146 | 216.479498 | 227.469560 | 238.710310 | 233.797065 | ... | 233.469238 | 235.160919 | 228.517306 | 228.349646 | 224.153606 | 230.860484 | 218.683195 | 232.949484 | 236.951938 | 227.997629 |
| 498 | 5.343171 | 1.041416 | 320 | 327.461442 | 323.019899 | 329.589337 | 313.312233 | 315.645050 | 324.448247 | 314.271045 | ... | 326.297700 | 309.893822 | 312.873223 | 322.356584 | 319.332809 | 319.405283 | 324.021917 | 312.363694 | 318.493866 | 310.973930 |
| 499 | 6.505106 | 3.626883 | 375 | 370.966595 | 364.668477 | 371.853566 | 373.574930 | 376.701708 | 356.905085 | 354.584022 | ... | 382.278782 | 379.460816 | 371.031640 | 370.272639 | 375.618182 | 369.252740 | 376.925543 | 391.863103 | 368.735260 | 368.520844 |
500 rows × 503 columns
학점 1 증가는 토익 100점 증가와 비슷하다고 고려하고 있다.
A. 이대로 분석 | 잘못됨
## step 1
df_train, df_test = sklearn.model_selection.train_test_split(df, test_size = 0.3, random_state = 42)
X = df_train.drop(['employment_score'], axis = 1)
y = df_train.employment_score
XX = df_test.drop(['employment_score'], axis = 1)
yy = df_test.employment_score

## step 2
predictr = sklearn.linear_model.LinearRegression()

## step 3
predictr.fit(X, y)

## step 4
predictr.score(X, y), predictr.score(XX, yy)
(1.0, 0.11705078212495712)두 점수가 큰 차이가 난다.(오차항까지 적합해버린 오버피팅의 상황)
s = pd.Series(predictr.coef_)
s.set_axis(X.columns, axis = 0)
gpa 0.035315
toeic 0.002680
toeic0 0.009333
toeic1 -0.017511
toeic2 0.005205
...
toeic495 -0.012811
toeic496 -0.007390
toeic497 -0.007487
toeic498 0.003379
toeic499 -0.002187
Length: 502, dtype: float64실제로는 gpa는 1, toeic은 0.01, 나머지는 0이 되어야 하지만, 많이 다르다…
### B. 제대로 분석했다면?
- toeic과 gpa만이 유의미한 변수라는 걸 눈치챔. (아다리, 현실세계에선 일어날 수 없음)
## step 1
df_train, df_test = sklearn.model_selection.train_test_split(df, test_size = 0.3, random_state = 42)
X = df_train.loc[:, ['toeic', 'gpa']]
y = df_train.employment_score
XX = df_test.loc[:, ['toeic', 'gpa']]
yy = df_test.employment_score

## step 2
predictr = sklearn.linear_model.LinearRegression()

## step 3
predictr.fit(X, y)

## step 4
predictr.score(X, y), predictr.score(XX, yy)
(0.9133033622085311, 0.9127346436925985)스코어도 높음
s = pd.Series(predictr.coef_)
s.set_axis(X.columns, axis = 0)
toeic 0.010063
gpa 0.972163
dtype: float64실제 계수값과 유사하도록 잘 추정됨
C. 하다못해 toeic0와 gpa로 적합했다면???
## step 1
df_train, df_test = sklearn.model_selection.train_test_split(df, test_size = 0.3, random_state = 42)
X = df_train.loc[:, ['toeic0', 'gpa']]
y = df_train.employment_score
XX = df_test.loc[:, ['toeic0', 'gpa']]
yy = df_test.employment_score

## step 2
predictr = sklearn.linear_model.LinearRegression()

## step 3
predictr.fit(X, y)

## step 4
predictr.score(X, y), predictr.score(XX, yy)
(0.9120540945251211, 0.9115427614193155)s = pd.Series(predictr.coef_)
s.set_axis(X.columns, axis = 0)toeic0 0.010101
gpa 0.981302
dtype: float64굉장히 합리적이다!
### D. 고찰
- 의문 : 왜 변수를 더 많이 넣었는데, 정보를 더 많이 제공해줬는데, 이상한 결과가 나올까???
규칙을 찾으면 안될 것 (반응변수와의 상관관계가 없는 것) 에서 규칙을 찾고 있으니까 (오차항을 적합) 잘 될리가 없지…
- 쓸모없는 변수?
- 진짜 쓰레기, 쓰잘데기 없는 것(X1 = 부먹/찍먹, X2 = 민초/반민초…) -> 애초에 이딴걸 가지고 y를 맞출 생각도 들지 않음…
- 실제론 쓸모 있는데, 대체제가 있는 경우 -> 대체제를 보고 y를 맞출 것 같기도 한데, 둘은 너무 비슷함…
- 1과 2 모두 과대적합(overfitting)을 야기하고, 2와 같은 상황에서 발생하는 문제를 다중공선성(multiple linearity)이라고 한다.
1은 corr(x_1, y), corr(x_2, y)가 낮게 나온다 -> y와의 관계가 없다. 2는 corr(x_1, y), corr(x_2, y)는 높게 나오는데, corr(x_1, x_2)도 높게 나온다.
4. 다중공선성의 특징
- 잘못된 분석을 재현하고, 계수를 해석해보자.
## step1: 데이터의 정리
df_train,df_test = sklearn.model_selection.train_test_split(df,test_size=0.3,random_state=42)
X = df_train.loc[:,'gpa':'toeic499']
XX = df_test.loc[:,'gpa':'toeic499']
y = df_train.loc[:,'employment_score']
yy = df_test.loc[:,'employment_score']
## step2: predictor 생성
predictr = sklearn.linear_model.LinearRegression()
## step3: predictor.fit을 이용하여 predictor 학습
predictr.fit(X,y)
## step4: predictor.predict을 이용하여 예측 -- pass LinearRegression()In a Jupyter environment, please rerun this cell to show the HTML representation or trust the notebook.
On GitHub, the HTML representation is unable to render, please try loading this page with nbviewer.org.
LinearRegression()
s = pd.Series(predictr.coef_)
s.index = X.columns
s
gpa 0.035315
toeic 0.002680
toeic0 0.009333
toeic1 -0.017511
toeic2 0.005205
...
toeic495 -0.012811
toeic496 -0.007390
toeic497 -0.007487
toeic498 0.003379
toeic499 -0.002187
Length: 502, dtype: float64- 특이사항
s.loc['toeic':].sum()0.010302732920633051비슷한 설명변수들의 회귀계수를 합하니까 0.01과 유사한 값이 나왔음…
fig, ax = plt.subplots(3)

for i in range(3):
    df_train, df_test = sklearn.model_selection.train_test_split(df, test_size = 0.3, random_state = i)
    X = df_train.drop(['employment_score'], axis = 1)
    XX = df_test.drop(['employment_score'], axis = 1)
    y = df_train.employment_score
    yy = df_test.employment_score

    predictr = sklearn.linear_model.LinearRegression()

    predictr.fit(X, y)

    s = pd.Series(predictr.coef_)
    ax[i].plot(s[1:], '-')
    ax[i].set_title('sum of toeic coef = {}'.format(round(s[1:].sum(), 4)))

fig.tight_layout()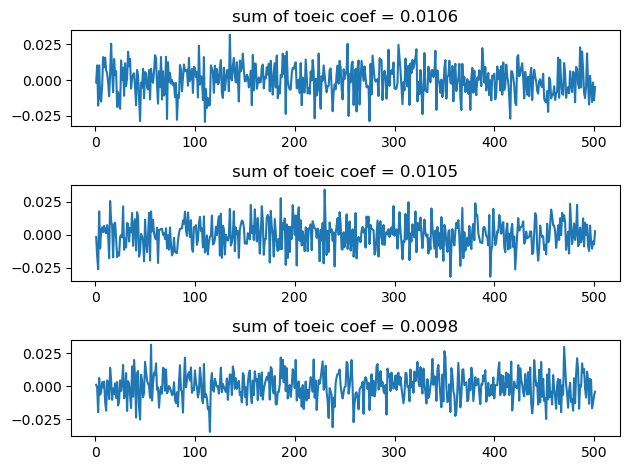
- 계수는 상당히 불안정하나, 그 합은 합리적인 값이 나온다.
- 계수값의 해석이 용이하지 않다. 음의 계수값이 있다는 것은, 토익 유사한 시험의 점수를 올리면 취업이 오히려 안된다(…)라는 것과도 같다.
이것의 해결은 직접 몇 개만 지우거나, 다중공선성을 해결하기 위해 패널티를 부여하는 모듈을 써서 해소 가능하다.